
As we inch closer to wrapping up this godforsaken White Sox season, there have been a lot of words written and spoken about where the rebuild is at for this franchise. Was there meaningful progress made? Who made that progress, and are they a key cog to a future contender? How much longer until we see the White Sox contend?
A question that I've pondered in the past couple of weeks is how far away are the White Sox to being average? Not every team can do what Atlanta and Oakland have done this season to come out of nowhere in earning their places in the postseason. It's an unexpected, pleasant surprise. I think the White Sox are due for one of those seasons soon, but if not, it would be nice if they could march closer to snapping their seven straight losing seasons streak in 2019.
For that to happen, the lineup needs to be better. Like, a lot better. Using data over the past ten seasons (2008 to 2018) I tried to figure out what "average" performance is for each position. In particular, looking at players that had the bulk amount of starts with at least 81 games played and at least half of that time at one specific position.
Below is the average WAR for each position is over the last ten seasons using Baseball-Reference.
| Position | bWAR Avg |
| Catcher | 1.7 |
| First Base | 1.9 |
| Second Base | 2.1 |
| Shortstop | 2.0 |
| Third Base | 2.2 |
| Left Field | 1.4 |
| Center Field | 2.4 |
| Right Field | 1.9 |
| Designated Hitter | 1.6 |
No surprise that the middle of the diamond is strongest and third base. Left field being the worst is a surprise. For a further offensive breakdown, here is the 10-year rolling average by position.
| Position | BA | OBP | SLG | HR | RBI | BB | SO |
| Catcher | 0.252 | 0.321 | 0.403 | 12 | 49 | 35 | 79 |
| First Base | 0.263 | 0.341 | 0.451 | 20 | 70 | 53 | 101 |
| Second Base | 0.267 | 0.328 | 0.402 | 11 | 51 | 38 | 81 |
| Shortstop | 0.261 | 0.317 | 0.388 | 10 | 50 | 35 | 82 |
| Third Base | 0.263 | 0.329 | 0.429 | 16 | 61 | 41 | 90 |
| Left Field | 0.260 | 0.328 | 0.425 | 13 | 51 | 37 | 86 |
| Center Field | 0.262 | 0.328 | 0.410 | 12 | 49 | 41 | 98 |
| Right Field | 0.265 | 0.336 | 0.438 | 16 | 60 | 45 | 97 |
| Designated Hitter | 0.262 | 0.339 | 0.461 | 24 | 78 | 55 | 108 |
Let's take a look at each position for the White Sox to gauge how far away they are achieving an average lineup.
Catcher
| Position | Player | Age | Games | WAR | Avg. Pos WAR (08-18) | Difference |
| C | Omar Narvaez | 26 | 90 | 1.9 | 1.7 | 0.2 |
On May 30th, Narvaez was hitting .169/.273/.234 and combined with his terrible defense should have been sent down to Charlotte. He wasn't because of Welington Castillo's suspension. Since June 1st, the offensive transformation for Narvaez has been astonishing. Narvaez is now hitting .277/.367/.442 for the season, and against right-handed pitching, he's hitting .298/.370/.482.
First Base
| Position | Player | Age | Games | WAR | Avg. Pos WAR (08-18) | Difference |
| 1B | Jose Abreu | 31 | 128 | 1.7 | 1.9 | -0.2 |
A terrible six-week stretch and injuries have set Jose Abreu back in 2018 posting career lows in WAR, batting average, and on-base percentage. Abreu will be turning 32 in January entering the final year of his contract with the White Sox. I still believe he could be a 2-3 WAR player in 2019 which would help the Sox having an average lineup, but beyond that the future is cloudy.
Second Base
| Position | Player | Age | Games | WAR | Avg. Pos WAR (08-18) | Difference |
| 2B | Yoan Moncada | 23 | 141 | 1.7 | 2.1 | -0.4 |
Yoan Moncada is not a bust, but he has too good of tools to be a 1.7 WAR second baseman. Next year, anything less than a 3 WAR season would be disappointing.
Shortstop
| Position | Player | Age | Games | WAR | Avg. Pos WAR (08-18) | Difference |
| SS | Tim Anderson | 25 | 146 | 2.6 | 2.0 | 0.8 |
For those worried about Moncada, Tim Anderson provides hope that an increasing level of performance is just a season away. Next step is finding a way to get on base more often, and I think that will have to come in the form of raising his batting average. If Anderson can return to his rookie level of hitting around .280 while maintaining his current walk rate, he'd be looking at an on-base percentage around .320 and providing a big boost to the Sox offense in 2019.
Third Base
| Position | Player | Age | Games | WAR | Avg. Pos WAR (08-18) | Difference |
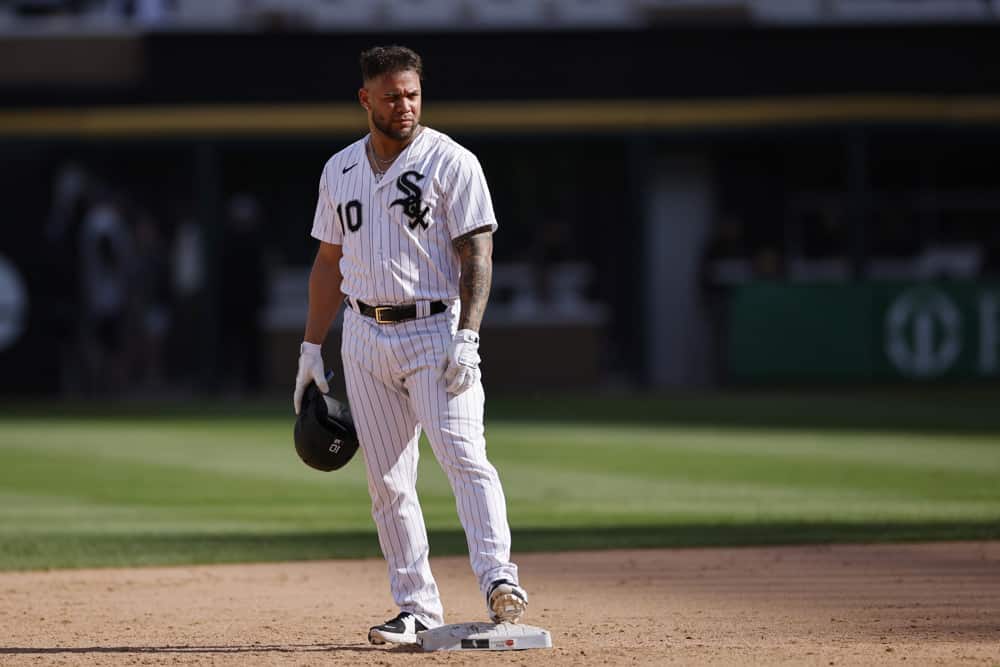
| 3B | Yolmer Sanchez | 26 | 146 | 3.1 | 2.2 | 0.9 |
Yolmer Sanchez was better in 2017 when he posted a 3.5 WAR season playing in 78 games at second base and 52 games at third. In 2018, Sanchez has made 133 starts at the hot corner, and the dip in performance is because of the bat. Against left-handed pitching, Sanchez is hitting .195/.277/.236 which screams platoon opportunity. Despite the drop in offense, Sanchez is still posting an above average season at third base.
Left Field
| Position | Player | Age | Games | WAR | Avg. Pos WAR (08-18) | Difference |
| LF | Nicky Delmonico | 25 | 83 | -0.4 | 1.4 | -1.8 |
Center Field
| Position | Player | Age | Games | WAR | Avg. Pos WAR (08-18) | Difference |
| CF | Adam Engel | 26 | 137 | 0.7 | 2.4 | -1.7 |
Right Field
| Position | Player | Age | Games | WAR | Avg. Pos WAR (08-18) | Difference |
| RF | Avisail Garcia | 27 | 85 | 0.3 | 1.9 | -1.6 |
The White Sox outfield is terrible. Injuries, lack of production, and limited talent put this unit five wins below the average WAR. Despite less than optimal play in left field for the league as a whole, Delmonico is not even above 0 WAR. 2017 season probably was a fluke year for Avisail Garcia as he enters his final contract year. Adam Engel has one elite skill, but his offense is so poor it puts him well behind other center fielders.
If you swap Eloy Jimenez for Delmonico, that could easily be a 2-3 WAR boost. Problem is Hahn will need to find other similar turnarounds in two of the three outfield spots. Maybe he addresses that issue in free agency or by trade, but most likely he will sit and wait until prospects mature. It is the cheaper option.
Designated Hitter
| Position | Player | Age | Games | WAR | Avg. Pos WAR (08-18) | Difference |
| DH | Matt Davidson | 27 | 111 | 1.5 | 1.6 | -0.1 |
Matt Davidson has appeared as the DH 63 times in 2018 while Daniel Palka has made 45. Neither have impressive slash lines when focusing on just hitting. Davidson is hitting .198/.301/.387 with ten home runs as the DH, and Palka is hitting .231/.289/.413 with eight home runs. If you just based it on his offensive numbers this season, Davidson should be on the field more often. He's hitting .279/.367/.473 in 35 games at first base, and if you think that's eye-opening, Davidson is hitting .318/.392/.659 in 13 games at third base.
I don't think manager Rick Renteria is ever going to have a permanent DH starter even though he should think about it with Palka. 15 players this season have made at least one start as the DH, and as a team, they are hitting .217/.304/.418 with 27 home runs and 80 RBI. The team could get more from this role, but it would require better hitters throughout the 25-man rather than just one particular player carrying the part.
*******************************
When you add up the average WAR for each position over the last ten years, it comes out to 17.3 WAR. The 2018 Chicago White Sox are at 13.1 WAR from the players who have spent the most time at these positions. That's a 4.2 win difference. If you squint hard enough there's a chance for a combination of progress from Moncada and Narvaez, the introduction of Eloy Jimenez, and healthier players could make up that gap for 2019. It could also go the other way where Abreu's decline continues as he leaves the prime years, Narvaez's season is a fluke, and of course injuries.
The future success of this rebuild rests on lineup quality. Lack of it is what got the White Sox in this mess, and it's been a central focus to develop better offensive players from trades and the draft. Even with the first wave of talent washing ashore in Chicago, the White Sox still have a ways to go to just being average.