
Late last year, Statcast added a tool that showed which directions outfielders excelled and struggled covering. By using Adam Engel and Daniel Palka in the same outfield, the White Sox delivered a positive and negative example of the tool right to our homes.
On Monday, Statcast unveiled another metric for outfielders, this one measuring how quickly a player gets moving in the right direction upon contact. It's called "jump," simply enough, and it's a way to reward outfielders who make tough plays look easy. The official definition from Mike Petriello:
"How many feet did he cover in the right direction in the first three seconds after pitch release?"
In order to better gauge a fielder's reaction, only plays with a 90 percent catch probability or harder will be considered, since an outfielder may dance with a can of corn for his comfort and/or amusement.
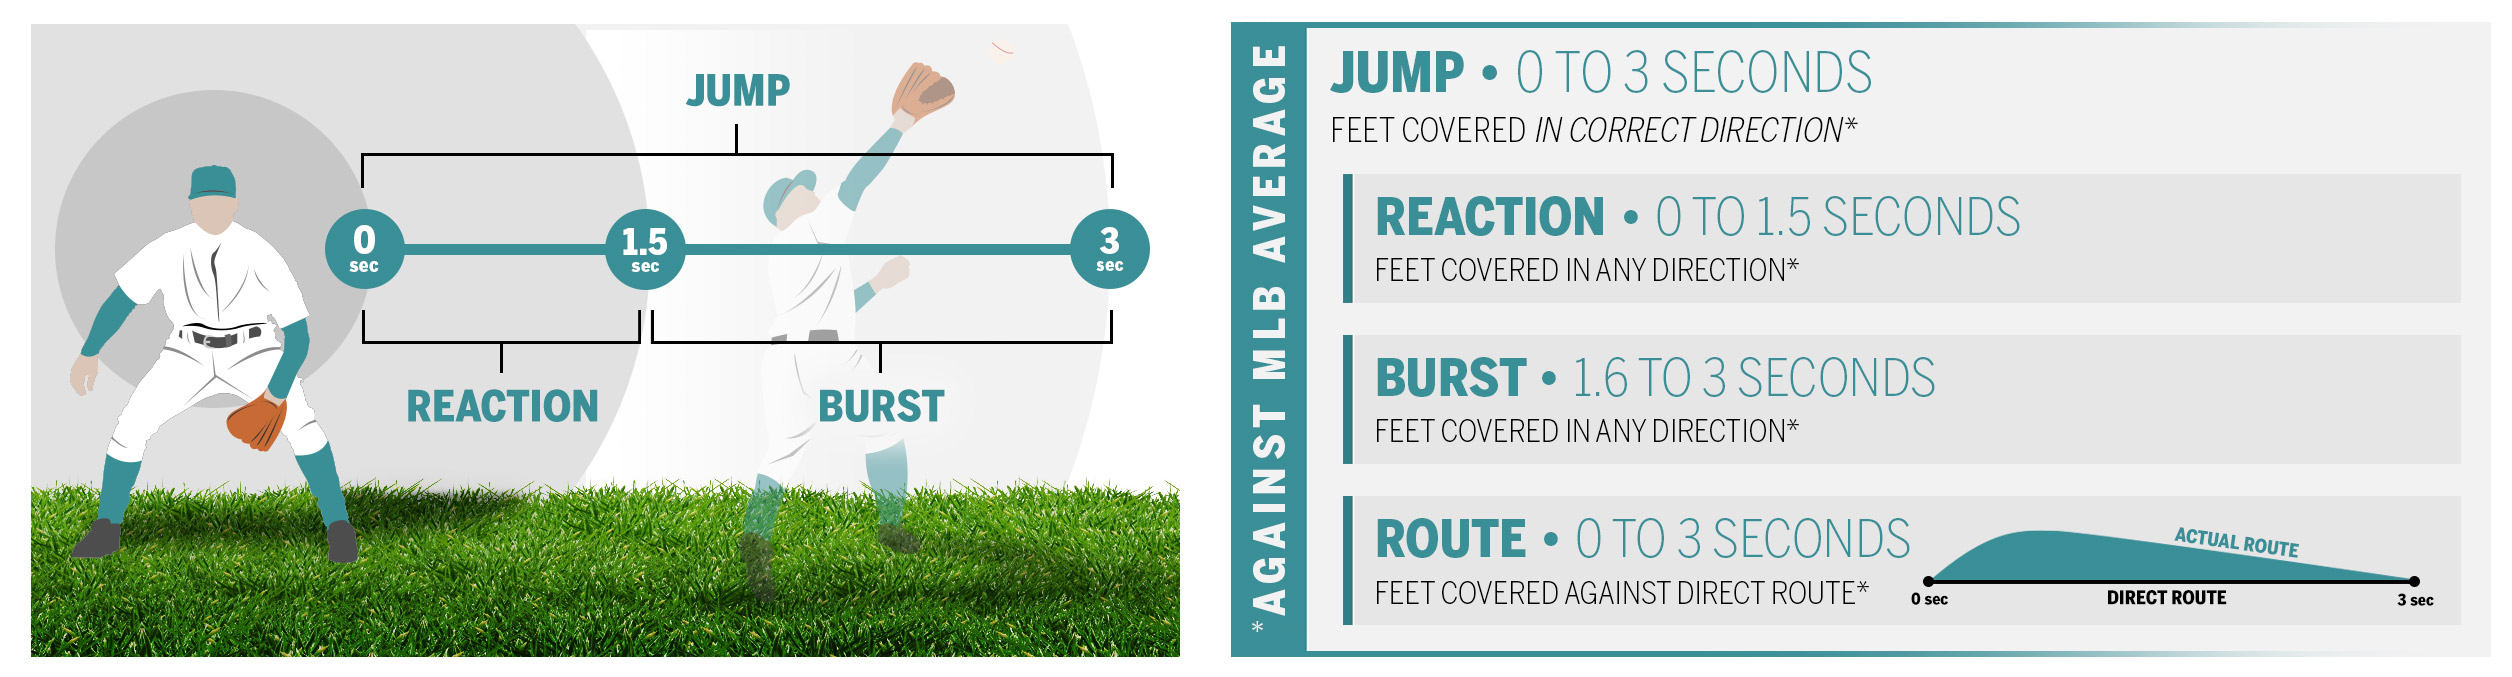
Statcast compiles "jump" from three components ...
- Reaction
- Burst
- Route
... and the crew put together a handy illustration:
Said crew has assembled retroactive leaderboards so we can understand what this looks like with a full season's worth of data.
If we apply the new metric to last year's conversation, Engel's "jump" was 1.5 feet above average, tied for ninth in baseball with Kevin Kiermaier, which is company you always want for a center fielder. Looking at the components of "jump," Engel's reaction time was sub-standard, but he made up for it with the second-best burst, and his routes were clean enough.
Palka, conversely, finished with a jump of 2.5 feet below average, which was 89th out of 103. If you want to compare the components between a good jump and a bad jump, here you go:
| Outfielder | Reaction | Burst | Route | Jump (feet vs. avg) |
| Engel | -0.6 | 1.8 | 0.3 | 1.5 |
| Palka | -0.9 | -1.5 | -0.1 | -2.5 |
The reaction times are similar, but once Engel decided on a direction, he made up for it. Palka did not, or could not.
Four feet over three seconds might not sound like a lot between two players at the extremes of defensive quality, but Petriello compares plays that were made against similar ones that weren't, and there's an elasticity to this metric when outfielders are pressed. On line drives to the gap that require immediate exertion, the differences in "jump" can stretch to six, seven, eight feet, and now we're talking about two or three steps within the first three seconds, which is considerably more substantial.
It's been a month since either Palka or Engel appeared in the White Sox' outfield, so that comparison may have run its course.
Apparently, Leury García and Charlie Tilson have taken their places.
There's nothing surprising about the 2019 leader in this category, as Kiermaier is off to the best start with his best starts. Once again, a White Sox center fielder is in the neighborhood of the gold standard:
- Kevin Kiermaier, 2.9
- Guillermo Heredia, 2.9
- Leury García, 2.0
- Harrison Bader, 1.7
- Joey Rickard, 1.5
If I had to issue a scouting report on García, I'd say it takes him time to settle on the right line to a ball that tests him, but he has refined his game with more regular play in center field. If this metric can be trusted from two-plus months worth of data, no further improvement is required.
If I had to put together a scouting report on Tilson's defense, I don't think I'd have much good to say. Sure enough, Tilson is 82nd out of 100 qualifying outfielders.
Let's stack up their components the way we did with Engel and Palka:
| Outfielder | Reaction | Burst | Route | Jump (feet vs. avg) |
| García | 0.3 | 1.1 | 0.7 | 2.0 |
| Tilson | -1.8 | 0.0 | -0.3 | -2.2 |
That looks about right, even down to the massive disparity in reaction time. Tilson is either slow to respond or super-cautious about doing so, but the result is a bottom-five reaction time. Mike Trout has the worst reaction time according to the metric, but he makes up for it with the line he takes. Tilson ... does not. Conversely, García's components look like that of a guy who has figured out how to harness his tools to respond to the demands of center field.
Statcast also has a dynamic graph that shows how players compare to peers with their jumps. García stands out a little bit, whereas Tilson stands out a lot.
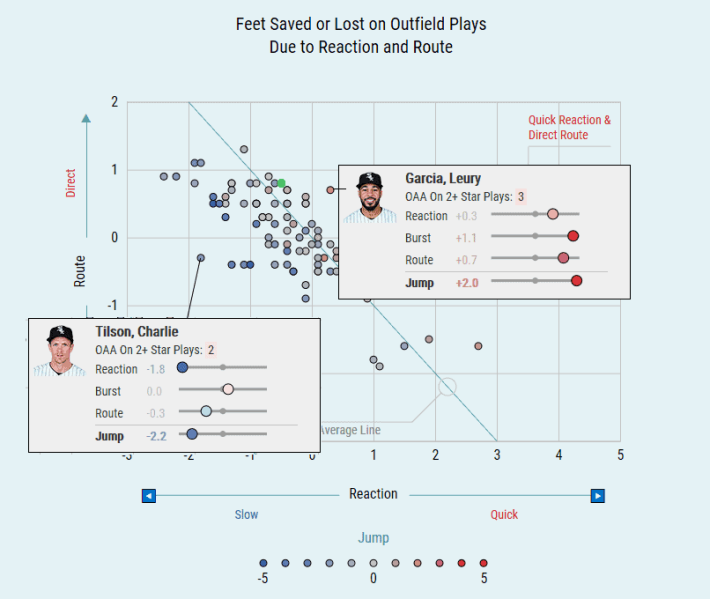
You may be wondering, "Where is Eloy Jiménez?" He's that green dot just left of García, closer to the center cluster. He's 61st out of 100 with his "jump," and his components aren't as easy to discuss. Let's add him to the table:
| Outfielder | Reaction | Burst | Route | Jump (feet vs. avg) |
| García | 0.3 | 1.1 | 0.7 | 2.0 |
| Tilson | -1.8 | 0.0 | -0.3 | -2.2 |
| Jiménez | -0.5 | -1.4 | 0.8 | -1.0 |
It doesn't surprise me that foot speed is Jiménez's biggest problem, but I am surprised that Statcast sees him taking better lines with his first steps than either García or Tilson. The definition for the route component is "feet covered against direct route," so I can see this meaning a few things.
No. 1: Jiménez's initial direction isn't bad, but his brain overrides his instincts and rounds off the route as some sort of anti-triples mechanism.
No. 2: This could look dramatically different with a more robust sample size.
No. 3: This isn't a metric worth using.
I'd table the third one for now, because you shouldn't expect analytics to merely confirm hunches. Also, it's pulling from the same data that calls Jiménez a bottom-three outfielder according to Outs Above Average, so there's a chance that Jiménez isn't closing nearly as well as he's opening.
If nothing else, it's worth freezing these numbers in time and revisiting the topic at the end of the season to see what happened. It's also worth acknowledging the way García is running with his opportunity when his body doesn't fail him under increased playing time. He's a little miscast as a leadoff man with his hyper-aggressive approach (.280/317/.360), but it turns out he's perfectly suited to handle center on an everyday basis.