
I've kept an eye on Dominic Fletcher's Defensive Runs Saved total over the past week, an exercise that's been as rewarding as following your 401K on an everyday basis.
It rose to +11 DRS this week, which is a staggering total for a guy with fewer than 300 innings played, but he'd also took advantage of a couple of opportunuties to support the spike. Fletcher made yet another difference-making play last Tuesday, as a throw from right field not only stopped a runner from advancing from first to third, but Nicky Lopez was able to cut it off and redirect it to first base to catch the trailing runner rounding too aggressively.
He followed that up with another bid for an assist on Wednesday, but Zach Neto was able to outrun Fletcher's best effort from right field to third to score the tying run in the eighth inning.
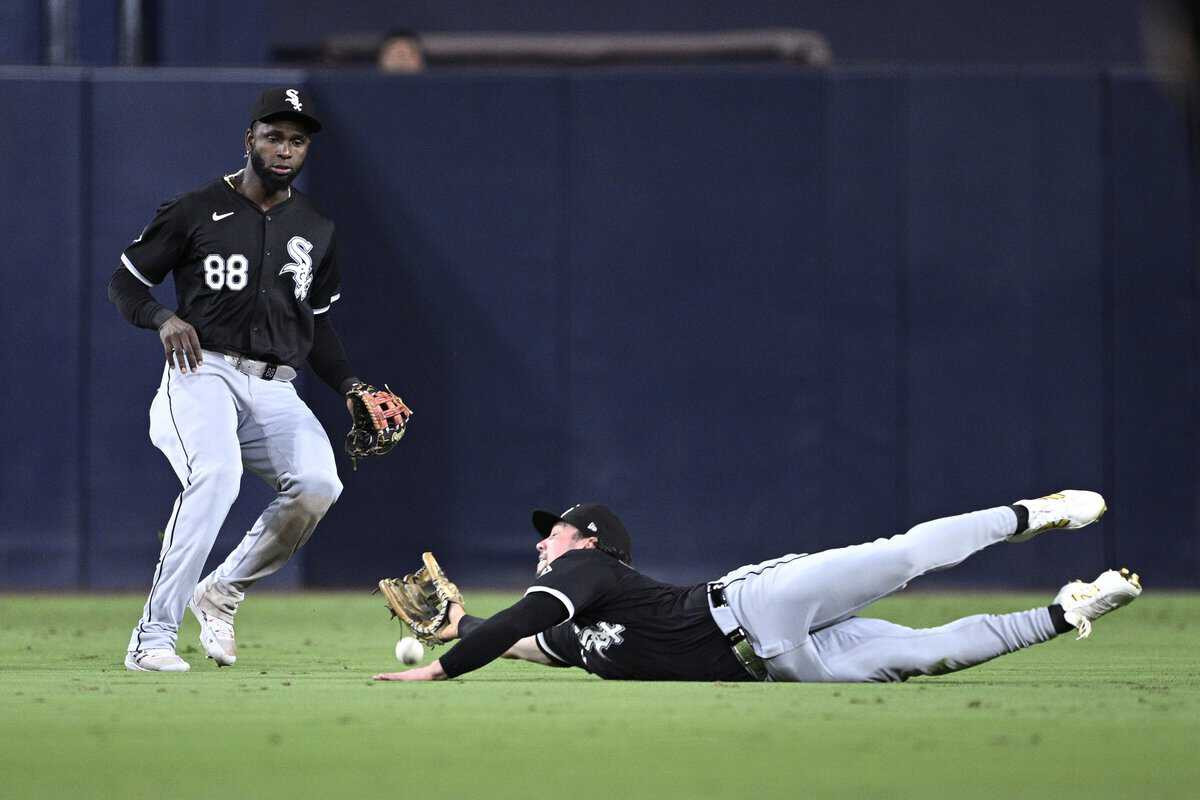
But if you check Fletcher's DRS total now, it's down to +9. That's still a very impressive rate, and while I can't speak to the way Baseball Info Solutions charts plays, it just so happens that Fletcher came up short on a pair of San Diego doubles over the weekend -- one by Jackson Merrill on Friday (pictured above), and one by Fernando Tatis Jr. on Saturday.
Statcast put the Tatis double at a 40 percent catch probability, while the Merrill double doesn't appear on Fletcher's defensive chart because the system says it landed in Luis Robert Jr.'s jurisdiction, so I don't think it's fair to ding Fletcher for the inability to complete two plus plays. If I hadn't been checking Fletcher's metrics every day or two, I'd see the +9 and think still represented an enthusiastic interpretation of his defense, rather than sweating a stock that gave up a little ground after weeks of sizable gains.
However, the slight dip in Fletcher's defensive score does reflect the lack of payoff in trying to extract corner outfield defense at the expense of corner outfield offense.
As well as Fletcher has manned right field, he's still hitting .205/.252/.259 on the season, including a .146/.175/.218 September that has wiped out all the progress from his post-injury rally. While that line is hampered by developmental playing time against left-handed pitching that a competing team wouldn't bother with, it's only to a minimal degree. Take out his 1-for-16 performance against lefties -- including 0-for-2 in high-leverage situations against San Diego -- and he's still short of the Mendoza Line.
Fletcher inadvertently embodies the flaw in Chris Getz's overall construction of the 2024 White Sox, in that he placed so much emphasis on defense over offense that any defensive setback is impossible overcome, whether it takes the shape of a true lapse or mere misfortune. Fletcher couldn't manage to close the remaining foot on Merrill's two-run double, and then he hit a rollover grounder to second base and couldn't get the go-ahead run home in the 10th. The inability to contribute on a supplemental or secondary level is what's draining the life out of the entire project.
If you're interested in the sustainability of Fletcher's defense, it seems like Statcast is the better measure. It has Fletcher at 3 Outs Above Average in right field, a total that stayed steady from one series to another, but the lack of volatility alone isn't the selling point.
One is this MLB Now video featuring Mike Petriello from MLB.com, and Mark Simon from Baseball Info Solutions, who discuss the differences in what DRS and OAA (or Fielding Run Value, which covers all positions) measures and emphasizes:
Fielding Run Value (FRV) vs. Defensive Runs Saved (DRS)@MarkASimonSays and @mike_petriello join #MLBNow to explain discrepancies between the two advanced fielding metrics. pic.twitter.com/Rihd86tJCU
— MLB Now (@MLBNow) September 17, 2024
In written form, Tom Tango, the senior data architect for Statcast and MLB, posted about the reliability of the systems based on how well they predict the other metric the following year (also, it provides a correlation value to make it more than "person partial to own system"). He gives DRS a slight advantage for infielders because of how Baseball Info Solutions handles the nuances of those positions.
For outfielders, though, he sees a different story:
I'll give you the knockout punch as well. FRV correlates with next-season's DRS better then DRS correlates with itself next-season: r=0.53 to r=0.51. Let that sink in for a bit. FRV knows nothing about DRS, knows nothing about how DRS measures things. And yet, it can predict next season's DRS better than DRS can (for outfielders).
Indeed, DRS can predict next season's FRV almost as well as it can predict itself: r=0.51 for self-correlation and r=0.49 for correlating FRV.
Why does this happen? Because the starting point of the outfielder and how much distance they have to cover is critical, and Statcast can precisely measure this.
In terms of weighting, I'd have to go at least 90/10 for FRV, if not 100/0.
Comparing this post to a Simon article from last week detailing the kinds of "good plays" Fletcher has generated, I'm sensing a FIP/ERA divide, where ERA (and/or RA) tells you what happened when a pitcher was on the mound, and FIP is better at suggesting how long that can continue to be the case. The latter question is a lot more useful for determining Fletcher's viability in any role, since so much of his value is reliant on playmaking.
In favor of the idea that the level of Fletcher's defensive success is repeatable, Statcast says he has a solidly above-average jump, and he differentiates himself with one of the league's best initial reactions, which helps make up for unremarkable top-end speed. Statcast says Fletcher ranks 20th among 107 outfielders in jump, but when you consider that Fletcher's 27th-percentile sprint speed is the lowest in the bunch, and only three others are below the 50th percentile, he's found a way around the physical shortcomings.
With regards to everything else, first base/outfielders coach Jason Bourgeois told James that Fletcher has calibrated his internal clock over the course of the season to maximize his efficiency at the end of plays.
"His reaction is one of the best in the league. The jump is one of the best in the league and for me, the finish is," Bourgeois said. "That's kind of not quantified, I don't think, but he finishes out plays really well. The arm is there, one of the best transfers in the game as far as from glove to throw. He's one of those guys that plays at a pace that's continuous and fast and it comes out a lot as execution on the back end. [...]
"The angles that he takes as far as cutting the runner down from taking the extra-base, that's huge and important. The league knows he can throw so when he plays at that pace and he takes those right angles, that really puts pressure on the coaches and the players to not take that extra base."
So whether you're using metrics or the eye test, Fletcher's above-averageness stands a decent chance of holding up. That just doesn't change the fact that it's just a tough play to make a living, especially if his knowledge of the angles doesn't translate as well to center field. Adam Eaton is the best example of how extraordinary defensive play completely changed his profile in a short-lived manner. In 2016, he hit .284/.362/.428 over 157 games. When pairing his good-not-great 117 OPS+ with his extraordinary showing in DRS (27) and OAA (25), it made him a top-10 player in the American League (6.6 WAR).
Meanwhile, when he hit .287/.375/.422 over 246 games with the Nationals in 2018-19, he was merely an average regular because a knee injury in the intervening season diminished his effectiveness in right field (-5 DRS, -10 OAA). Fletcher's offense surely hasn't been aided by a sprained shoulder that cost him the month of June and was sore for longer, but since it was acquired with the life-and-limb commitment to finishing plays that powers his defensive work, it only perpetuates the disquieting elements of the Eaton parallels.
More exciting aspects of the comparison don't exist. Eaton's game overlapped enough to create a bubble, and the Sox were able to take advantage of it. Here, Fletcher's offense is so underwater that his best work in right field can't get him to replacement level by either metric (-0.3 bWAR, -0.8 fWAR). Any drift back towards average, whether due to injury, age or other fluctuation in speed or performance, makes him a far more natural fit for Charlotte instead of Chicago.